Red Camera Testing, page 2
by John Beale  Jan. 2008  
back to page one

NOTE: in August 2014 I had to remove all R3D files after my site was suspended for over-large files. Sorry.

Test #4: Q-13 Greyscale with Black Q13 Red 2k image

RAW:   2k-Q13-T4-18mm-1-9.R3D   2k-Q13-T4-50mm-1-10.R3D

The 
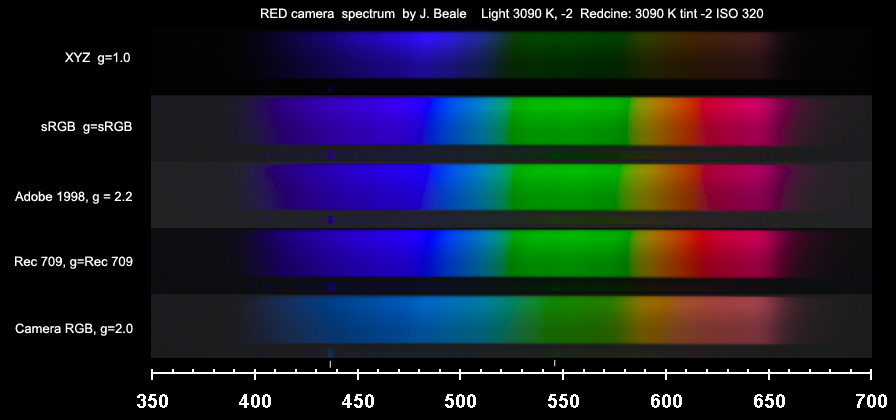
Red camera was fixed at 5' from the target, with the lens set at 18 mm and 50 mm, exposure T4 + 2/3. The measured light level and foamcore background was the same as in Test #3.  Below the color chart is the 8" long Kodak Q-13 Gray Scale, which has 20 regions with density ranging from 0.05 (nearly white) to 1.95 (dark grey) in steps of 0.1 OD or 1/3 stop, so the full Q13 range is 6.3 stops.

Immediately to the right of the Q-13 chart is a hole cut in the foamcore, with an empty black box and matching opening placed directly behind the hole (see top-view diagram at right).  The hole creates a good reference black level, since the rear inside of the box visible to the camera is not directly illuminated. On the foamcore to the right of the hole is a piece of black gaffer tape. In practice the hole area was an eerie total black; absolutely nothing inside was visible to the eye.

Since the surrounding area is white, this test can be used to check for lens flare by comparing the recorded level in the small black hole area with Test 1, an entirely black frame (lens cap on).
diagram showing hole in test chart, top view

Test #5: Stouffer T4110 Stepchart Stouffer T4110 with Canon 20D, in-camera JPEG  20D: Lightbox without chart (fits between arrows)

RAW:  4k-T4110-T3-1-13.R3D  2k-T4110-T4-1-1.R3D   (4k: T3.0, 2k: T4 +1/3. Both: 1/25 s, all three exposure "traffic lights" on)
Canon 20D: JPEG, RAW CR2 (0.3 sec, f/8.0, ISO 200)

The Stouffer T4110 transmission step wedge has 41 density steps with 0.1 OD separation (1/3 stop), so it has an optical density range covering 13.3 stops. This chart can be used to test the dynamic range of a camera + lens, assuming that the light box is evenly illuminated, and there is no ambient light reflecting back from the front of the chart.

The T4110 was placed on a custom-built light box using a fluorescent bulb as the source and internal baffles arranged to maximize the uniformity of the light across the test chart region. In the photo taken by the 20D of the bare lightbox without the chart present (it goes in the area between the two arrows) you can observe how even the lighting is.  The bulb is a T8 15" 14W "Sun-Glo" aquarium bulb, CCT=4200 K. The camera's best dynamic range is apparently in light around 5000 K, so this is not the optimal light source. Fluorescent light was chosen because it has very little infrared. The T4110 is probably not correctly calibrated for infrared.  The area of the lightbox outside the T4110 chart was masked off with black paper and black wrap, the room was dark and the camera's LCD viewscreen was dimmed and back screen covered to reduce possible stray bounce light.  To test for effects of lens flare, a shot was also taken with the brightest part of the chart obscured.

Since the image becomes progressively more noisy at lower illumination levels, there is a judgement call involved in deciding what is a usable amount of signal or image data, and what is simply noise.  If you average over an arbitrarily large area, you may measure a large total dynamic range, but that number may not have much relevance in cases where some visible image detail is needed.

The data in the first plot below, chosen arbitrarily from one scanline in the 4k R3D data, shows some unexpected tilt on steps near in the midrange. It may be a stray reflection or lens flare. It is not trivial to get solid numbers from this test.  Second plot compares the data from Red and a Canon 20D.

T4110 data from Red 

Notes: frame size not matched precisely pixel-for-pixel. 20D has advantage of ISO 200 setting. 20D CR2 file converted by  Breezebrowser Pro, "linear" output.  Red R3D file converted by custom utility with linear (?) output.  To my mind, these chart present more questions than answers. If you have questions, please do your own test.  Let me know your results!


Test #6: Spectrometer    RED color spectrum  20D spectrum, f/8, 0.5 sec, ISO 200

RAW:  2k-Spectra-1-11.R3D  (T3, 1/24 sec, ISO 320)
Canon 20D: spectrum.jpg (f/8, 0.5 sec, ISO 200)

In this test the Red camera is looking into a spectroscope. An unfiltered tungsten light (T= 3090 K CC-2) is reflected from a spectrally flat white surface onto the slit, and the camera lens is behind a diffraction grating which spreads the white light out into separate wavelengths.  A bottom portion of the slit is blocked off from the tungsten light, and is illuminated separately by a fluorescent light, to provide calibration based on mercury lines (blue: 435.8 nm, green: 546.1 nm. Not shown here, see: fluorescent spectra).  This image was taken in Red 2K mode and converted to TIFF using Redcine with Camera RGB, Gamma=2. The bottom calibration bars and R,G,B components done in Photoshop.  Note that the red and blue channels drop below the black level in the blue and red regions respectively, essentially becoming negative values in those areas.  The color temperature setting in Redcine will affect this output. For the Camera RGB test at the left, the Redcine color temp. was 4571 K, tint -17. For the rightmost set of 5 color spaces, Redcine color temperature at 3090 K, tint -2, ISO 320, Sat 1.0, Exp 0.0 and all color controls at default (0).


Camera RGB, gamma = 2

All 5 color spaces: XYZ, sRGB, Adobe 1998, Rec 709, Camera RGB.

By comparison to the Canon 20D, the Red One camera appears to have less response in the infrared region, and slightly more in the ultraviolet. In another test, the Red recorded a 385 nm UV LED light relatively more strongly than the 20D did.


Test #7: Crystal Bowl, rotating Crystal Bowl on turntable (1k JPEG)   Red One, 18-55mm lens with colored reflection

RAW:   Crystal_Bowl-A001_C019_080108.R3D  (370 MB, 4k 16:9, 24 fps, 1/48 sec, 304 frames)
MP4 Video: 432x240  1024x576 (23.97 fps)
Another clip:  mpeg2  mpeg4  (both 1080p, 30 fps, 50 Mbps, 6 seconds)

This clip shows an 8-inch diameter crystal bowl rotating on a turntable while I do a focus pull, from beyond the far edge of bowl inwards to the near edge.  The mp4 file looks bad (too light) on a PC using Quicktime player. It looks better in VLC or Nero Showtime 2.

Lens set at 50mm, T11
Distance from optical center of lens to midpoint of bowl:  53 cm (21 inches)
Single light: Lowel Omni 500W with flags & scrim, black backdrop
Incident meter: ISO 320, T16 + 0.3, 3090 K, CC-2
Red 4k (16:9) format, 24 fps 1/48 shutter

Redcine does not export 4k files on any computer I have access to, so I used the Cineform utility r3d2dpx along with levels, curves & whitebalance on each dpx frame in Photoshop CS2. I then exported the frames as 16-bit PNG from Photoshop and loaded those into Vegas 8 which was used to generate the MP4 files.  The debayer algorithm in the r3d2dpx utility may not be suitable for critical 4k output at the moment, but I have not yet seen anything untoward with output at 1/2-full resolution.  I did some sharpening in PS which may have been a mistake for the 1k resolution output in particular, which probably looks more jittery as a consequence.

The turntable was made from an old IBM Deskstar 15GB hard drive spindle bearing and the actual rotation was very smooth, gradually slowing down over time.  An earlier attempt at a turntable using a hardware store lazy-susan bearing (not shown) was very much less smooth.


Test #8: Color Pinholes six Rosco gels with transmission spectrum plots

RAW:   4k-ColorDots-T8-1-21-1.R3D  ( T8 )
20D:  20D-pinholes.png  20D-pinholes-overexposed.png

One thing Bayer-pattern sensors may have difficulty with is very small colored dots.  This experiment uses different colored filters back-illuminated through a diffusing sheet, placed behind pinholes made in black-wrap foil. Note that the pinholes were made by hand and are not of uniform size. The goal is to test the camera response to small areas of color.  At first glance it appears that both the Red and 20D cameras have more difficulty with small red and blue dots as compared with other colors. This is what one would predict from a sensor pattern having twice as many pixels sensitive to green, than to red or blue.


...back to Page One